System application examples
- Home
- Portfoio Details
1. Granulometric composition analysis
- Category: Computer vision
- Client: Large mining and processing company
- Project date: 2020
The granulometric composition analysis system, developed utilizing advanced computer vision technologies, delivers high precision in gauging particle size distribution. This system is particularly applicable to numerous industrial entities, notably within the mining, processing, and metallurgical sectors. By assessing the granulometric composition of materials directly on conveyor belts, it can offer a highly relevant solution for these industries.


| Real position (stones) | Real position (background) | Accuracy | Recall | T(1 frame) | |
|---|---|---|---|---|---|
| Stones | TP = 936 | FP = 490 | 60% | 84% | 0.04s |
| Background | FN = 134 | TN = 0 | 60% | 84% | 0.04s |
Table 1 (Watershed method)
| Real position (stones) | Real position (background) | Accuracy | Recall | T(1 frame) | |
|---|---|---|---|---|---|
| Stones | TP = 947 | FP = 56 | 60% | 84% | 0.04s |
| Background | FN = 23 | TN = 0 | 60% | 84% | 0.04s |
Table 2 (Neural network)
Traditional evaluation methods, involving manual laboratory studies of selectively sampled materials and visual oversight by an operator, are often less desirable due to their inefficiency and potential inaccuracies. However, a computer vision-based system offers a solution, achieving up to 95% accuracy in granulometric assessment.
Unlike conventional manual checks that focus on random sample locations, machine vision systems analyze the entire surface of raw materials, thereby providing a more comprehensive and precise assessment. This encompasses:
- Detection and sizing of individual granules
- Identification of impurities
- Classification of granules according to size
- Predictive analysis of granule size distribution throughout the depth of material flow
These capabilities become particularly crucial during the crushing and grinding stages, as well as during ore preparation. These processes are energy-intensive and any disruption, such as material blockage, can lead to significant downtime, affecting overall production. Machine vision algorithms, by recognizing potential inclusions in the ore flow that might pose a risk, enable optimization of crusher control and, in urgent scenarios, halt the conveyor system.
The implementation of this system yields multiple benefits:
- Prevention of expedited wear and tear of production assets
- Reduction in laboratory analysis costs for fractions
- Minimization of operating expenses in production
- Enhancement of mined mineral quality control
- Improvement of operational management quality
- Mitigation of human error
System implementation involves several stages:
- Installation and configuration of necessary equipment (if necessary)
- Data collection for model development, retraining, and optimization under specific conditions
- Integration with existing production systems
2. Analysis of the movement of objects (people, cars, etc.)
- Category: Computer vision
- Client: Commercial client
- Project date: 2022
The system delivers detailed analysis of object movements, including people, cars, trucks, bicycles, motorcycles, pedestrians, or any user-specified object.


Its key strength lies in its scalability and efficiency, allowing for rapid deployment of an industrial-grade solution capable of addressing a broad array of tasks, from traffic monitoring on public roads to object tracking in shopping centers, security checkpoints, factory workshops, and conveyor belts. This system's ease of use comes from its intuitive space-marking functionality, further model training capabilities, an integrated pre-trained system for object detection and tracking, and its seamless compatibility with other library components.
Its adaptability for both indoor and outdoor environments is facilitated by a graphical interface that allows users to define areas and flows. Displaying an initial video frame or any frame from a surveillance camera, users can draw any number of lines for counting objects traversing through them or define arbitrarily-shaped areas to monitor the presence or absence of certain objects.
Although the developed functionality is compatible with any object detection and tracking algorithm, the default configuration utilizes the YOLOv5 model for object detection and a correlation multi-tracking algorithm for object tracking. These solutions ensure high accuracy, with tracking introduced to enhance system speed by reducing hardware load, thereby lowering the costs of developing more specialized solutions without significant loss of detection accuracy.
During the operation of the flow analysis the system displays information about various tracked objects. It exhibits object frames that aid in assessing the precision of object detection and tracking. Different object types are indicated with different frame colors. Upon crossing a predefined line, an object is registered in the system, potentially triggering an audio or text alert in the console. For more complex behaviors upon line crossing, the system can function as an API.

Defined area example

An example of determining the arrival in a given area
Due to the model's adaptability to diverse lighting conditions, the object detector maintains high accuracy day or night under various light sources.
3. Utilizing Computer Vision for In-Depth Analysis of Froth Flotation Enrichment Processes
- Category: Computer vision
- Client: Large Industrial Company
- Project date: 2021

Froth Flotation

Cylindrical Flotation Cell

Foam Samples
Detection of bubble size, number of bubbles, and rate of froth descent by computer vision methods.
Key analyzed indicators:
- Foam color
- Bubble diameter (distribution)
- Foam Removal Speed

Source image and calculated contours
The computer vision system generates segmentation maps which are crucial for:
- Building dimensions
- Tracking
- Evaluating specific bubble color

Creating a training sample using the watershed method

Training of the U-net neural network to detect only large foam
- The area is calculated using a breadth-first search algorithm based on binarized segmentation maps
- Bubble centers are calculated by calculating their centers of mass
- The distance between the bubbles depends on their area, the coordinates of the centers and certain hyperparameters
- Tracking is performed by finding the nearest bubbles from the next frame relative to the function of the distance between the bubbles
- If the minimum distance for a particular bubble exceeds a preset threshold, we infer that it has collapsed
4. Real-Time Analysis and Control System for Blast Furnace Brake System
- Category: Computer vision
- Client: Large Industrial Company
- Project date: 2021

Original image

Original image

Computed contours
System Overview
The system utilizes a video stream, video file, or set of photographs as input parameters and generates results by detecting various process characteristics:
- Monitoring the actual compression and decompression of the brake pads
- Distance measurement
and deviation warning from the specified value. Additionally, optimal video quality and frames per second (fps) recommendations are provided.
Segmentation Maps:
- For distance calculation
- For tracking and color assessment
Steps:
- Object capture
- Contour extraction
- Calculation of distances between objects in pixels based on their area, color, center coordinates, and specific hyperparameters
- Conversion of pixel distances into the metric system
- Object tracking
The system achieves an accuracy of approximately 1mm.
5. Flat parts classification system
- Category: Computer vision
- Client: Large Industrial Company
- Project date: 2022
System Overview
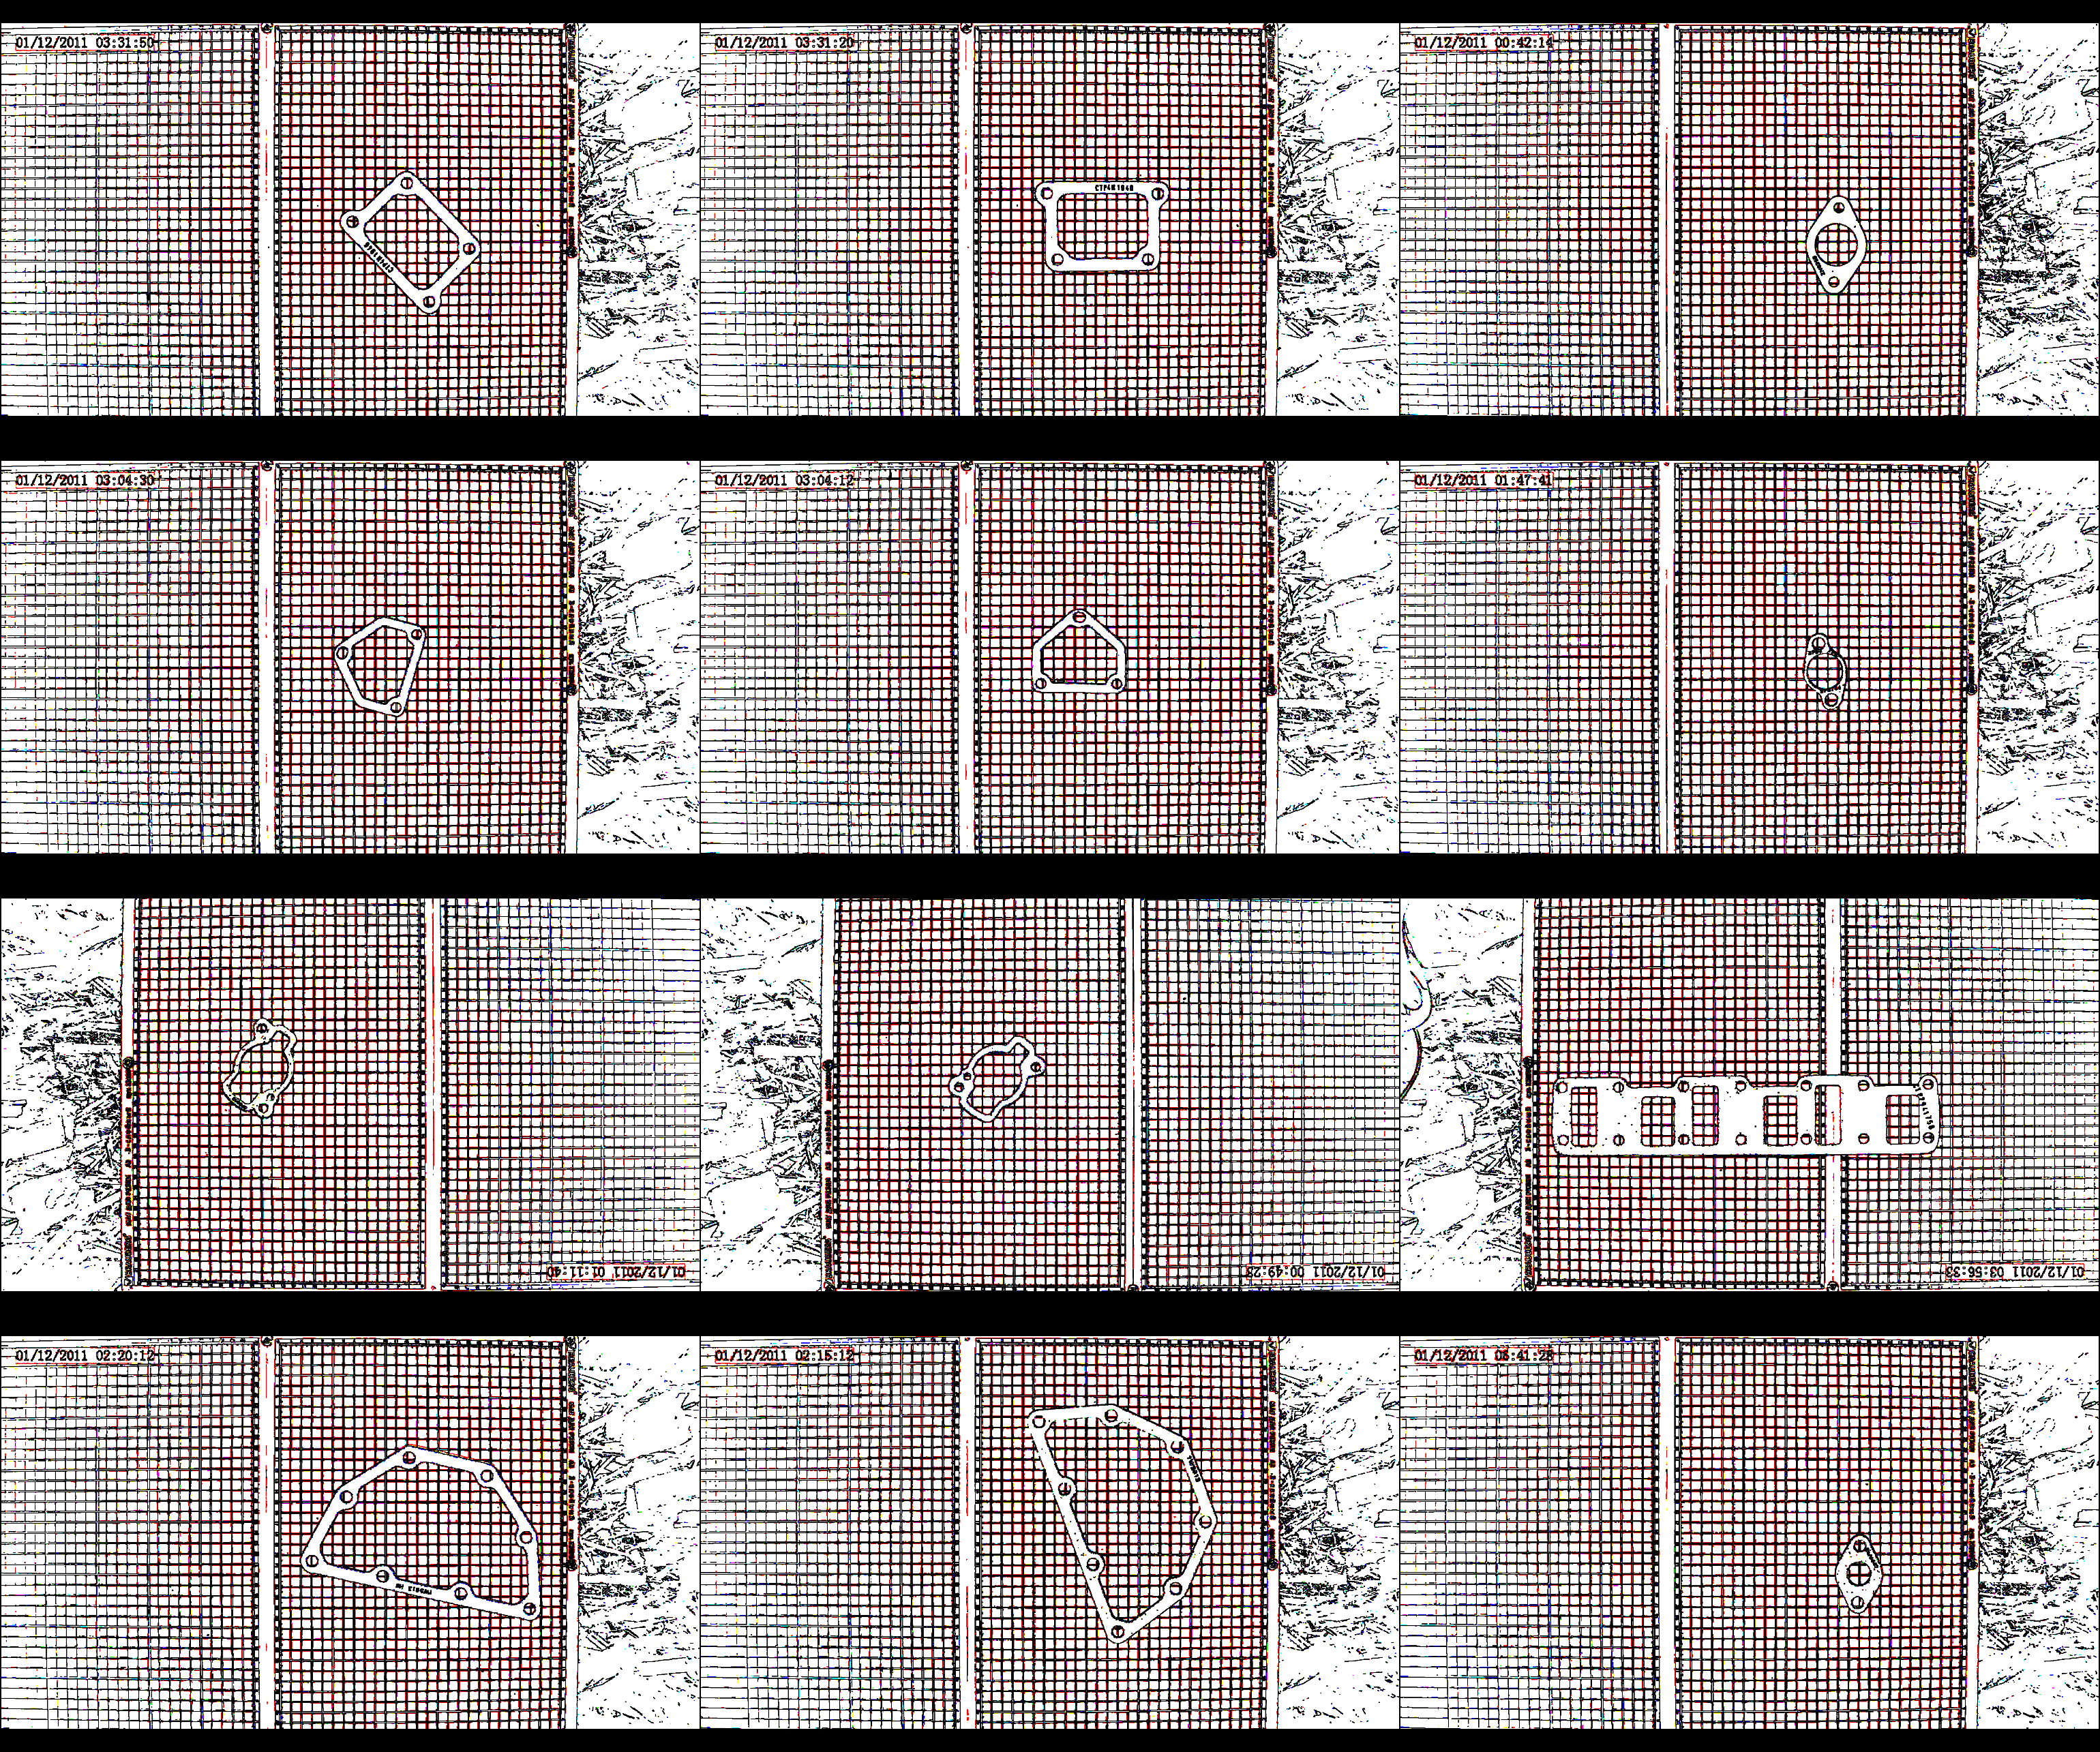
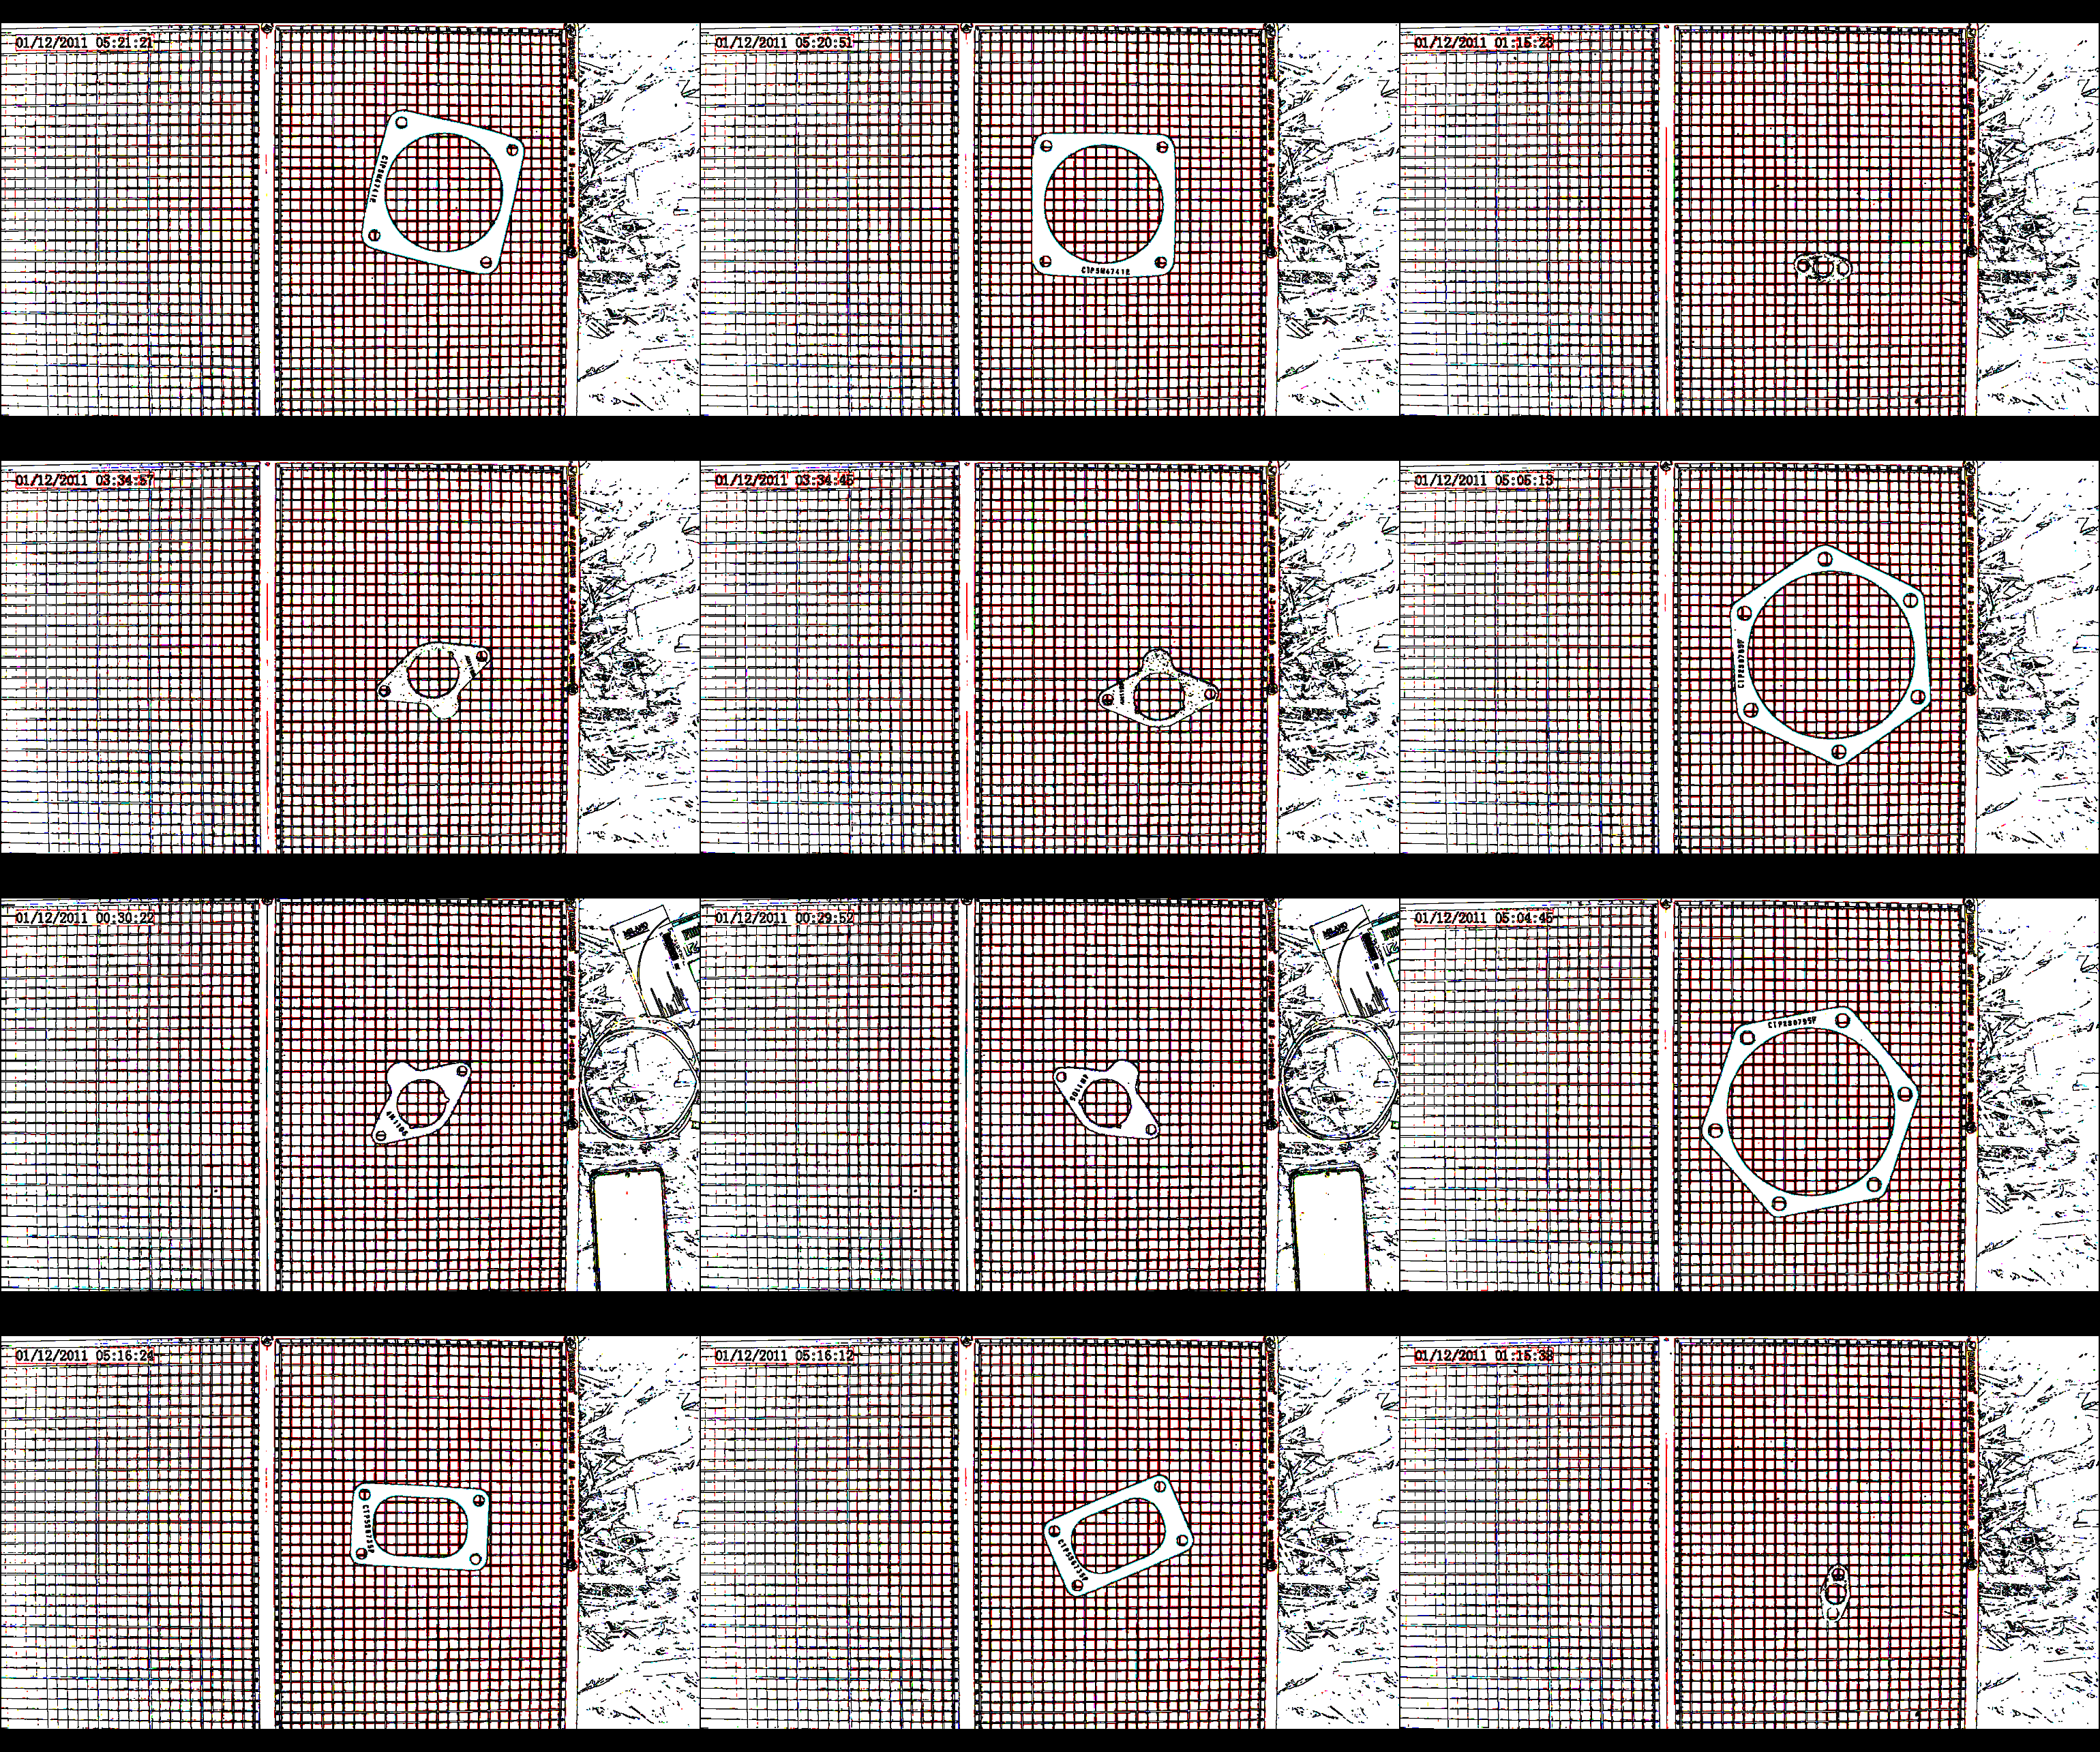
A system for classifying flat parts has been developed. Ninety percent of the range falls in size from 20mm to 600mm, parts smaller than 200mm can vary in size by no more than 1mm.
The photograph of the part is used as the input parameters of the system. The result is formed as a classification of the part (assigning the part to one of 3800 classes). The system allows you to add new types of parts for classification (introduce a new nomenclature into the system), and also has the ability to generate data for a label printer.
The system achieves an accuracy of approximately 99,9%.


Example

Train batch

Valid batch
